
For industrial sites
One model of your site. Every decision on the same basis.
We rebuild your site from your own data: consumption, generation, peaks, grid connection and contracts. Then we test every option, on its own and combined, so management can decide what to do next.
- Fully transparent
- Fixed price per question
- Delivery with partners is optional
Why this matters
Everyone sees a piece. Management needs the whole.
The grid connection is full
A new machine or hall does not simply fit, and a heavier connection can take years.
Every advisor has a product
The installer suggests solar, the supplier a battery, the energy company a new contract. Each is right about its own piece.
Prices move every quarter-hour
Dynamic contracts and feed-in make the timing of use as important as the volume.
How we work
Four steps, from data to a decision
01 · Collect
Data and context
Quarter-hour data, energy and grid contracts, installations and expansion plans. A short site visit to agree the question.
02 · Rebuild
Your site as a model
A digital model that reproduces your real costs, peaks and grid limits, checked against your invoices.
03 · Test
Every option, same basis
Battery, solar, contract, process shifts or a heavier connection: return, cost and risk side by side.
04 · Decide
A clear recommendation
What to do, in which order, and what it delivers, discussed with management.
Inside the model
This is what we actually build
Not a slide with assumptions, but a working model of your site that stays in place. Every next question is answered faster.
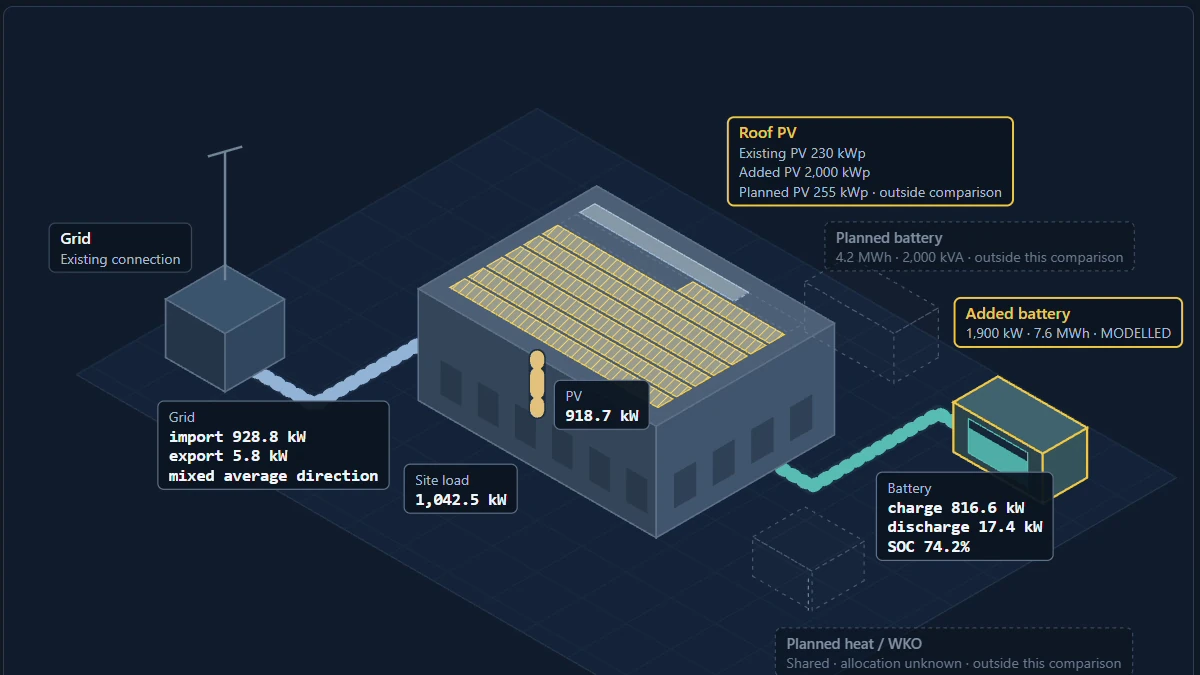
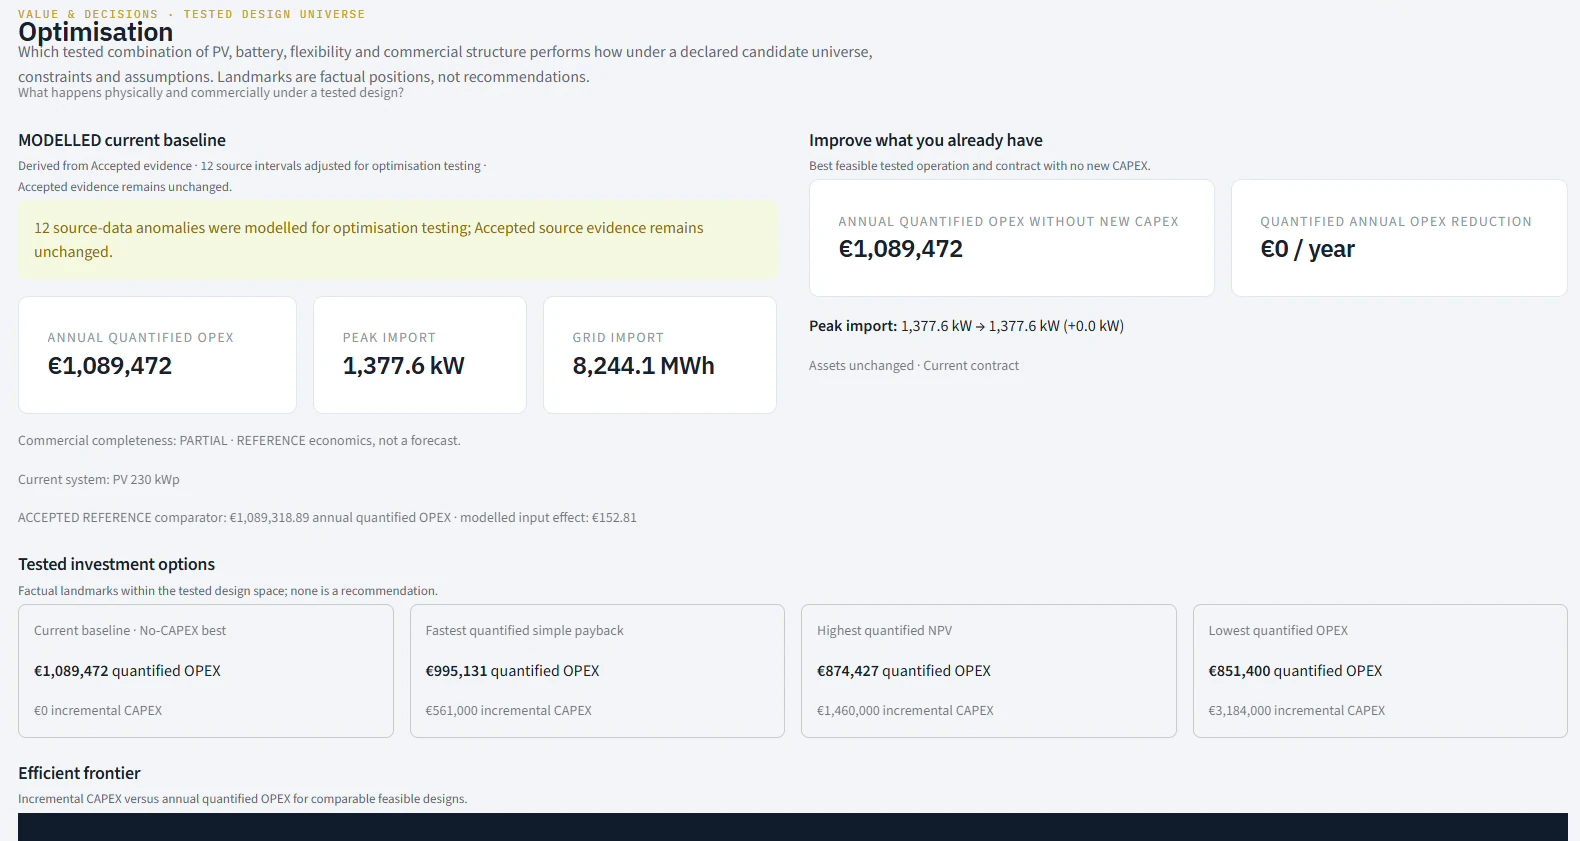
Screenshots from the PROTAR platform, example data.
Questions we answer
Start with the one on your table now
Efficient frontier
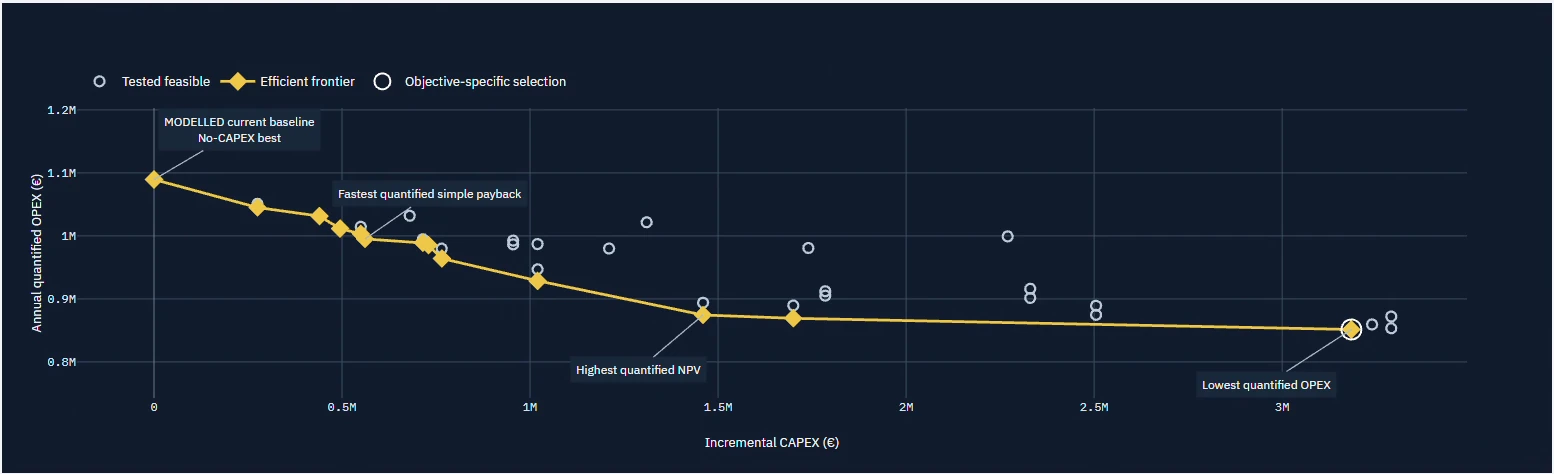
Which investment first: every design on one chart
Each dot is a tested combination of solar, battery, flexibility and contract. The gold line connects the designs where no alternative is both cheaper to build and cheaper to run. From the no-CAPEX baseline to the lowest running cost, you see what each extra euro of investment buys.
Screenshot from the PROTAR platform, example data: 37 feasible designs, 13 on the frontier.
What we need
- Quarter-hour data for consumption and generation
- Energy and grid contracts
- Details of installations and plans
- An introduction and site visit to agree the scope
Results
- Insight into costs, peaks and grid headroom
- Options calculated, alone and combined
- A substantiated recommendation
- Results discussed with management and next steps decided
- If needed, full outsourcing of the selected next steps
Transparent, free to choose
- Every assumption and euro visible
- Clear, pre-agreed price per question
- We and our partners can deliver it, but you don’t have to
- If you wish, PROTAR stays on as your energy partner
Start with one site and one decision
Tell us what is on the table. We reply within two working days.