

For owners of solar and wind assets
Every MWh measured. Every euro captured.
PROTAR compares what your assets produced with what they should have produced, values every quarter-hour in the market and, if needed, handles certificates and route to market. Built for owners who want clear control over their assets, without the need for a full in-house team.
- Read-only data access
- No new hardware
- Fees shown upfront
The problem
Most owners only see the loss when the annual statement disappoints.
Shading, soiling, vegetation, a tripped inverter or curtailment at the wrong moment: each costs output without anyone noticing. The inverter portal shows data, but nobody compares it with what the park should have delivered.
On the commercial side it is the same. What does your supplier really pay after profile and imbalance costs? Are your certificates sold, and at what price? When does your contract end, and what is the better alternative?
The service
Three layers. Start with the first, add the rest when it pays.
01 · Performance
Expected versus actual, per inverter
- Modelled output from irradiance and your layout
- Zero-output periods and underperformance detected
- Alerts in plain language, with the estimated loss in euros
- One-page monthly report
02 · Market value
What your output is really worth
- Capture price per quarter-hour against the market
- Curtailment at negative prices: done right, or missed?
- Supplier or PPA terms checked: profile, imbalance, fees
- Contract end dates tracked in advance
- Grid value calculated, plus complementary investments such as a battery or extra solar
03 · Certificates & route to market
Sell smarter, with less admin
- Guarantees of origin registered, bundled and sold
- Route-to-market options compared when your contract ends
- PPA, subsidy or index-based hedging arranged for you
- Our fee is fixed and shown on every statement
From the platform
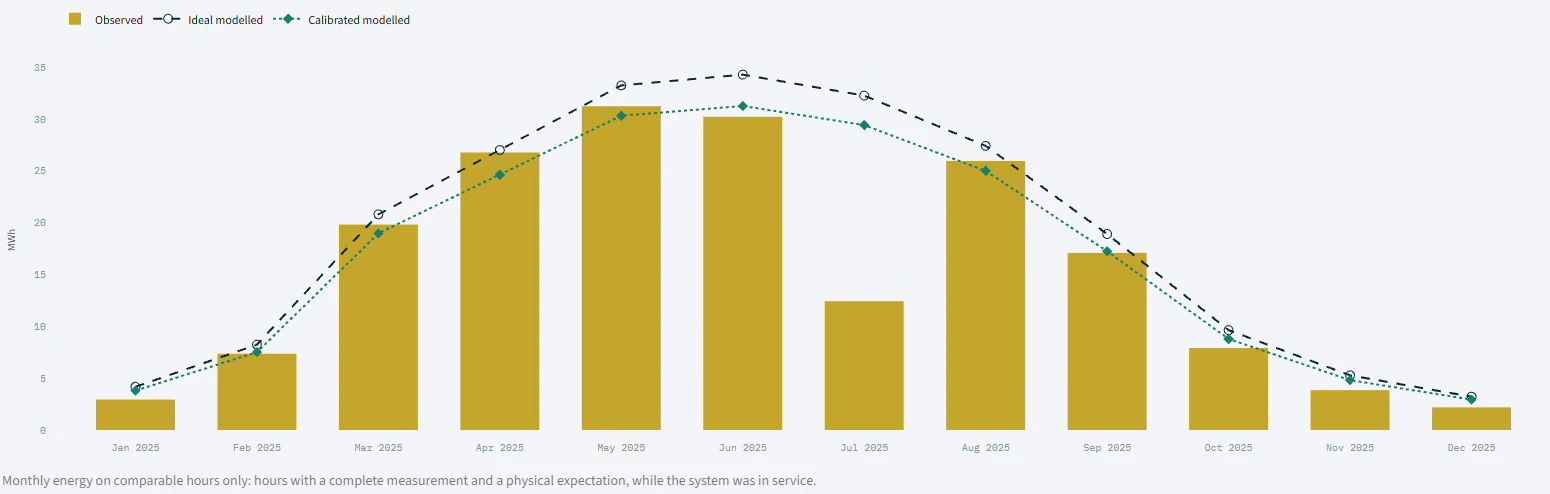
See the month the park went quiet
Measured output (bars) against the ideal and calibrated model (lines). In this example July fell far below expectation: 18 zero-output days that nobody had flagged.
Screenshot from the PROTAR platform, example data.

Know your options
When your contract ends, we put the routes side by side
Illustrative comparison. For your park we calculate it with your own production profile and current market prices.
| Route to market | Price risk | Upside | Admin for you |
|---|---|---|---|
| Standard supplier contract | Low | Low | Low |
| Fixed-price PPA | Low, volume risk remains | Medium | Medium |
| Market-following PPA | High | High | Medium |
| Aggregated, certificates sold separately | Medium | Medium to high | Low, PROTAR handles it |
How to start
Three months, no cost, then you decide
Week 1
Connect in one hour
Read-only access to your inverter portal and meter data. Nothing to install.
Months 1–3
Free monitoring
Alerts and a monthly report, including a first look at your contract and certificates.
After 3 months
Review and choose
We show what was found and what it was worth. Then you decide whether to continue, or stop.
The free check is available for a limited number of parks. Certificate and route-to-market fees are agreed upfront and shown on every statement.
How does your park score?
Upload your data, plan a short call or send us a question. We reply within two working days.