
Higher grid costs are coming. But do you know what is actually driving your energy bill?
Grid costs are rising, while energy bills are becoming more complex. For industrial users, the real question is no longer just how much energy they consume, but whether consumption, grid capacity, contracts and assets still work together economically.
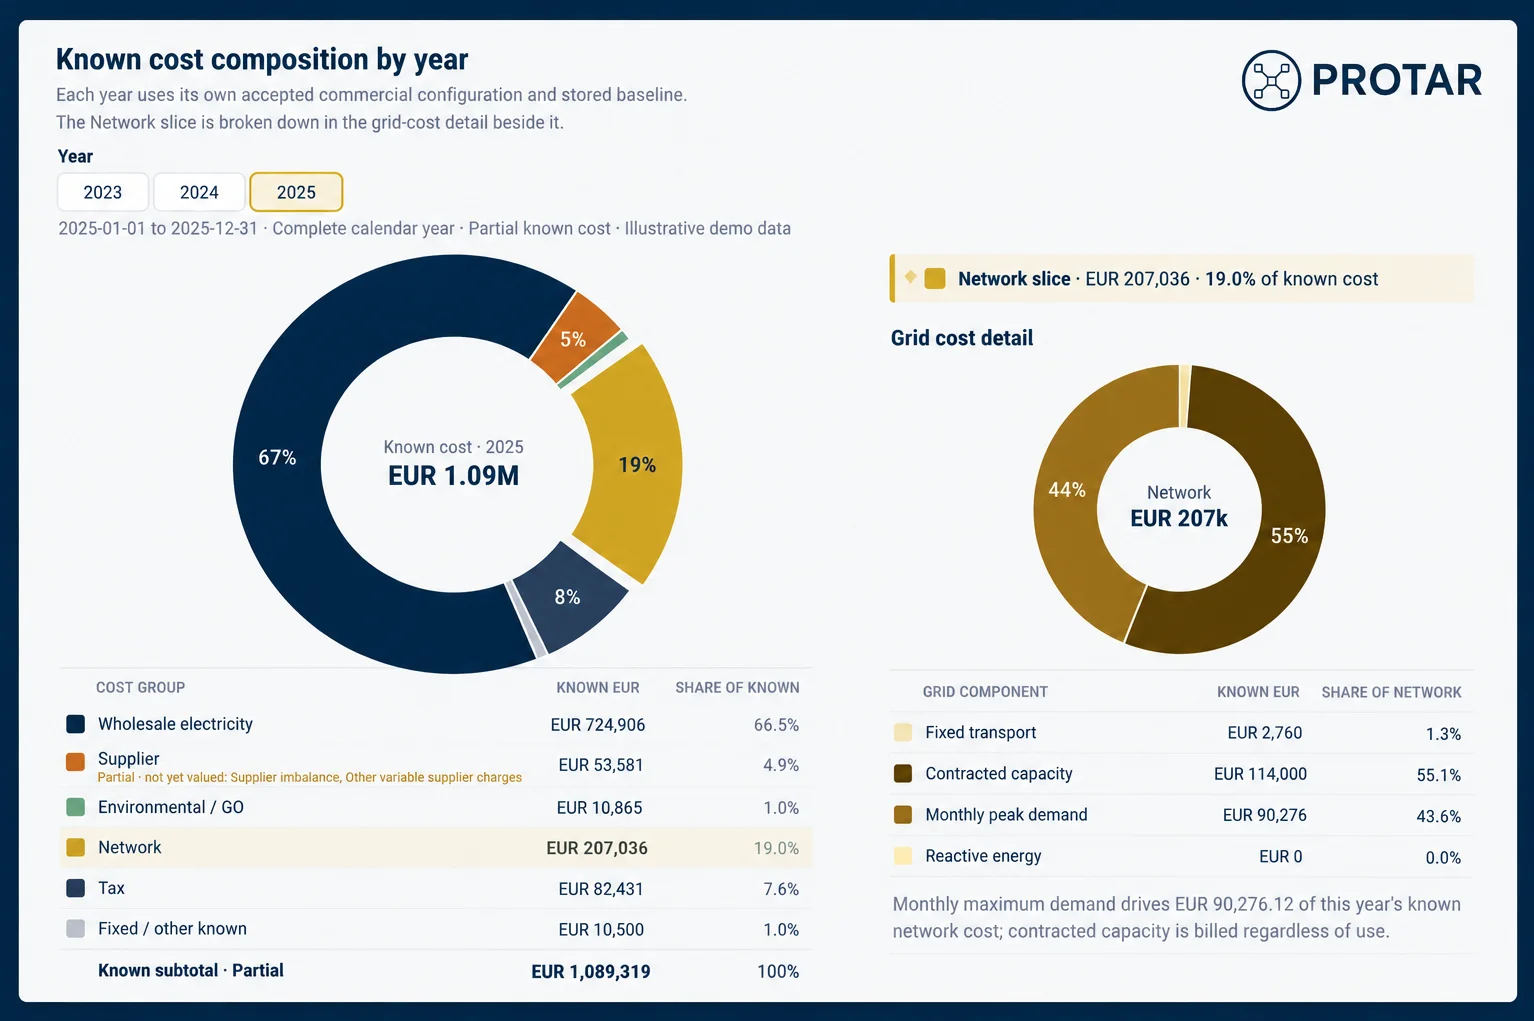
Higher grid costs are coming. But do you know what is actually driving your energy bill?
Energy costs are not only increasing. They are also becoming harder to manage.
In the Netherlands, the regulator expects transport tariffs to rise materially as grid operators invest heavily in expanding and reinforcing the electricity network.
At the same time, recent research showed that many smaller users may be paying for more grid capacity than they actually need.
For industrial energy users, the underlying question is even broader:
Do your consumption, contracted capacity, energy contracts and investments still fit together?
Energy is no longer just volume × price
For an industrial site, the economic outcome is increasingly determined by several interacting factors:
- when electricity is consumed;
- peak demand;
- contracted and available grid capacity;
- energy contract structure;
- solar generation;
- flexibility;
- batteries and other assets;
- network charges, taxes and certificates.
These factors cannot be assessed independently.
A battery may lower energy-purchasing costs while increasing monthly peak charges. Additional solar may reduce annual imports, while its wholesale market value declines during increasingly oversupplied hours.
That is why a single energy-price figure rarely tells the full story.
Turning fragmented energy data into one decision model
PROTAR combines meter data, grid connections, contracts, market data and energy assets into one site model.
The first step is understanding the current position:
- where energy is consumed and generated;
- where peaks occur;
- which cost components matter;
- how grid capacity is used;
- how existing assets perform;
- and how the physical profile interacts with the market.
From there, alternative decisions can be tested on the same basis.
For example:
- additional solar;
- different battery sizes and operating strategies;
- load flexibility;
- electrification;
- grid-capacity constraints;
- or different combinations of physical assets and commercial structures.
The aim is not to automatically label one technology as the “best” solution.
It is to make clear where value comes from, which trade-offs a decision creates and which assumptions still need to be verified.
If this sounds relevant to your organisation, feel free to get in touch.
---
Image: anonymised example from the PROTAR demo environment. Commercial contract assumptions shown in the demo are synthetic.